Data Analysis
Realtime data analysis at the click of a button!
Pie-charts
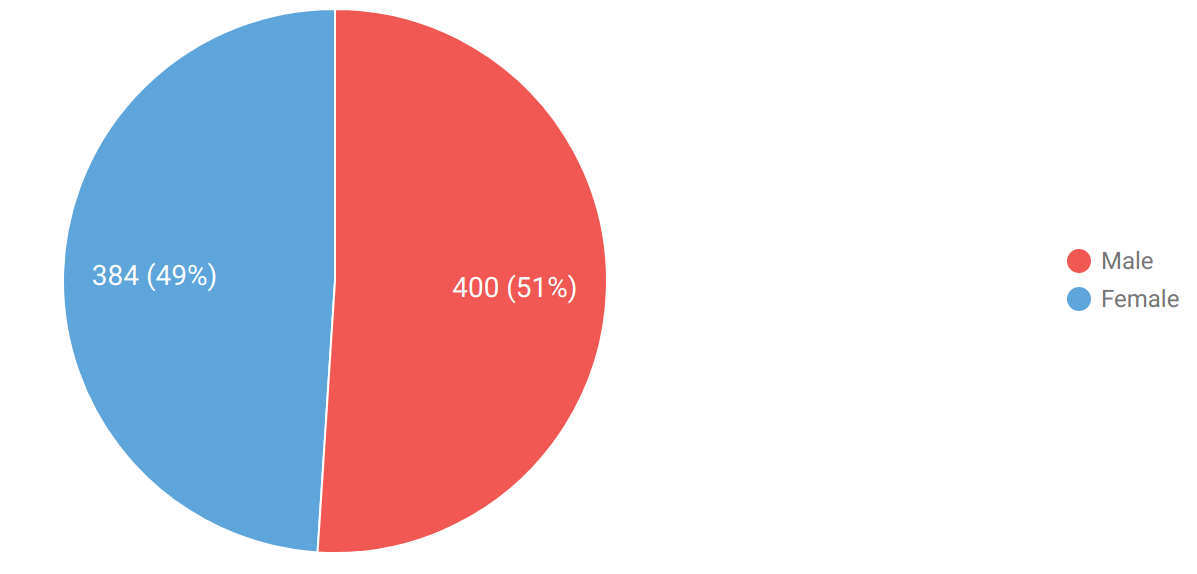
Binary variables are automatically analyzed and rendered on pie-charts to show the distribution. E.g. Gender: Male vs Female

Bar-charts
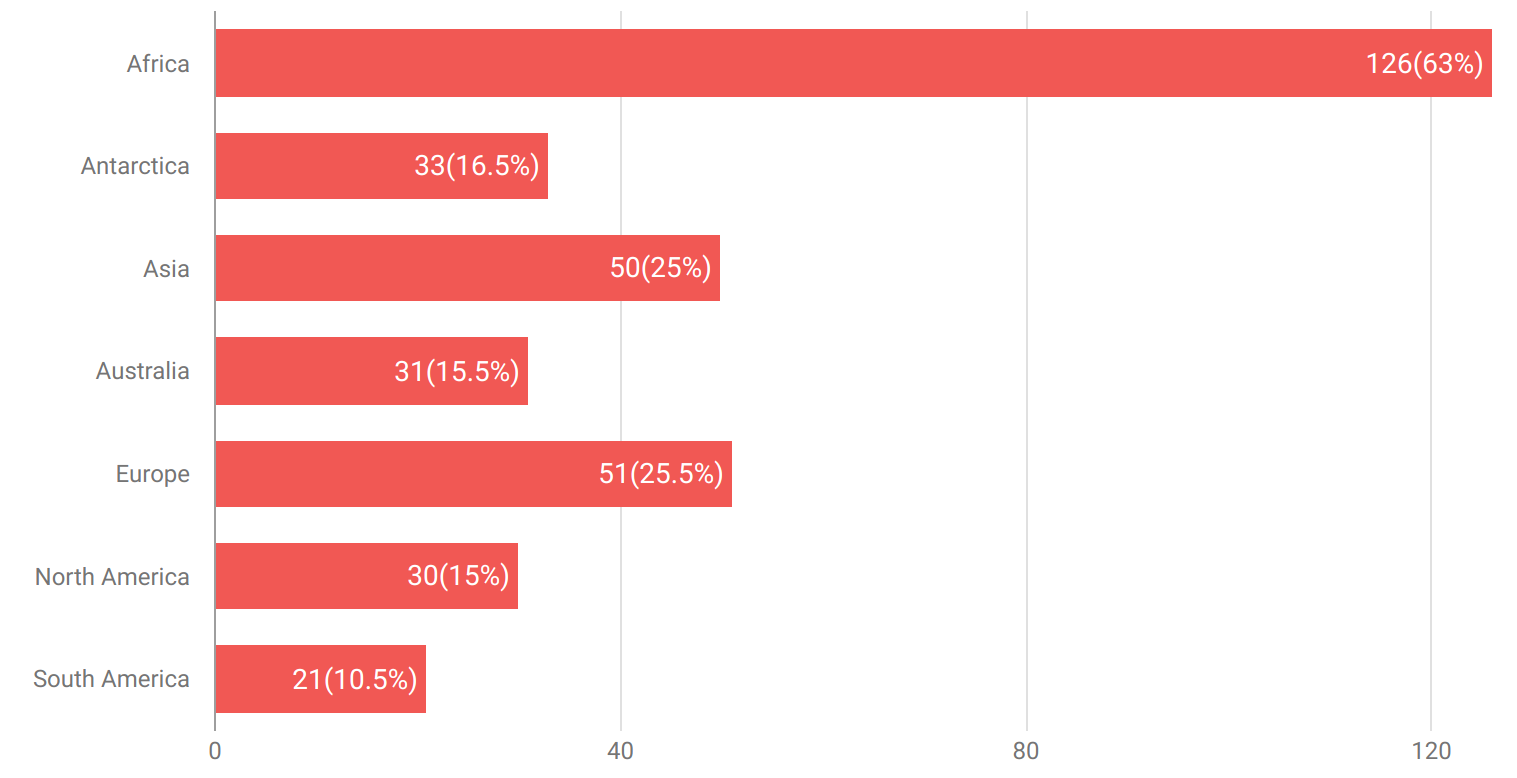
Categorical variables are automatically analyzed and rendered on bar-charts to show the distribution. E.g. Continent of origin

Frequency tables
Categories that cannot reasonably fit in a bar-chart are rendered on a frequency table to show the distribution. E.g. Interviews per enumerator

Histograms
Numeric variables are rendered on histograms. Summary statistics for central tendency, dispersion and shape are also included. E.g. Age

Word-trees
Free text is rendered on word-trees to show the most common words and the relationships between them. E.g. Comments

Pivot table
The in-built pivot table enables you to easily prepare data summaries, cross-tabulations and custom charts.

Trend analysis
Use line charts to analyze trends over time. You can even disaggregate the output by a variable of your choice.

Geo-maps
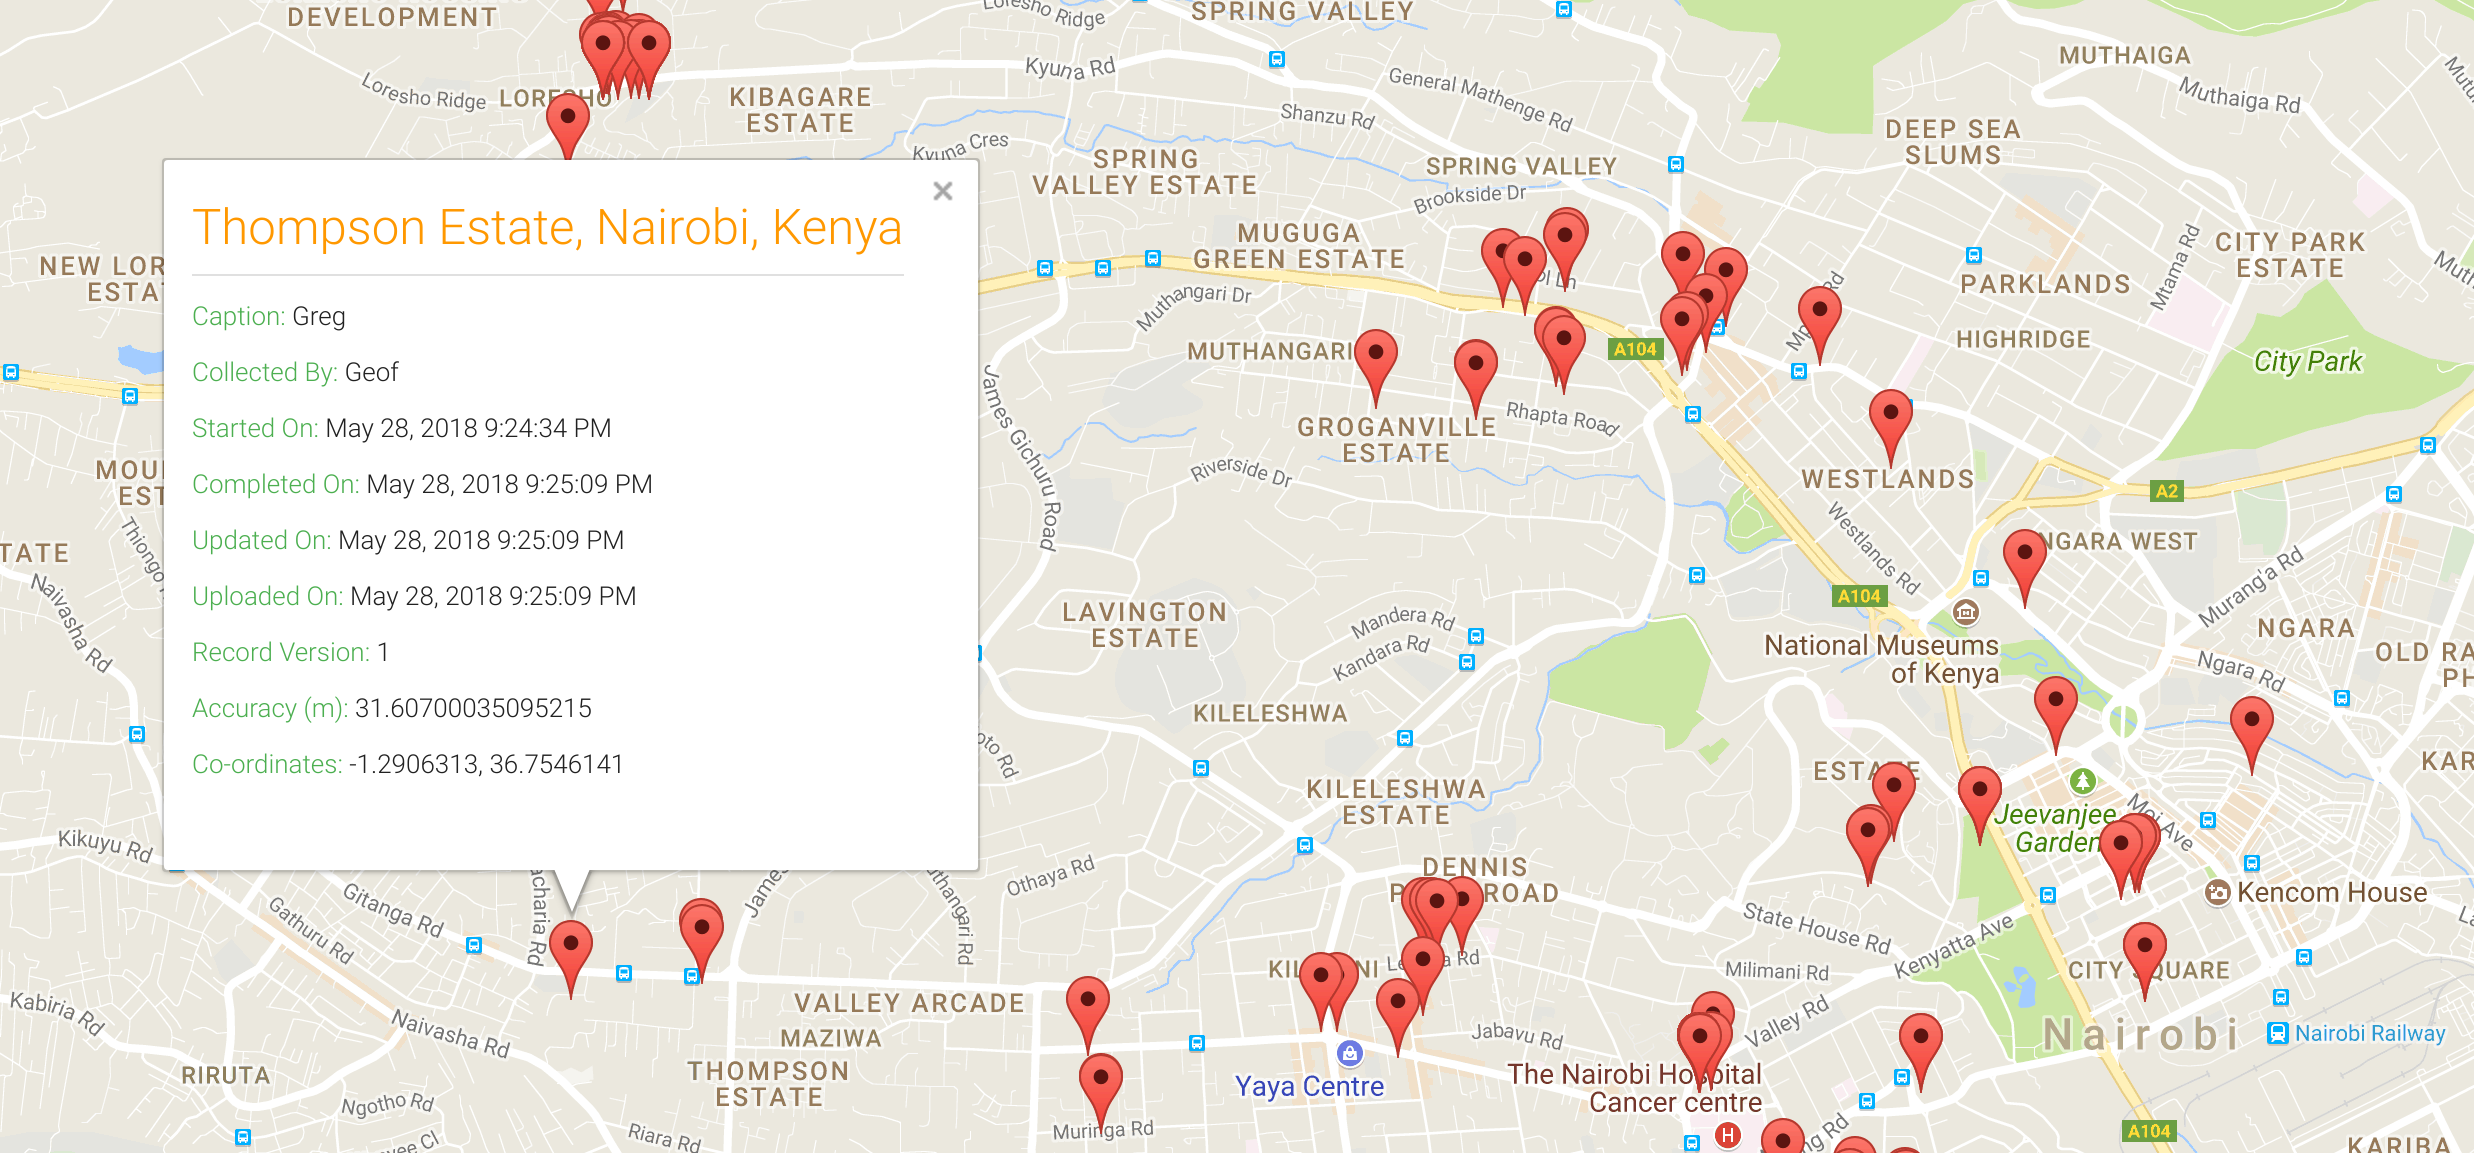
Visualize your data-points on a map from right within Hoji. You don’t have to guess where your enumerators are collecting data from.
