One of the most common questions we receive on our support channels is how to meaningfully summarize large datasets. Often, people are clear about the end result, they just don’t know how to get there.
Many of the desired summaries can be easily achieved using pivot tables. Pivot tables are an incredibly powerful data processing tool, but they can also be a bit intimidating for beginners, so not many people learn how to use them well.
In this 3-part series, we’re going to demystify this handy technology and show you how to use it to slice and dice your data like a real pro.
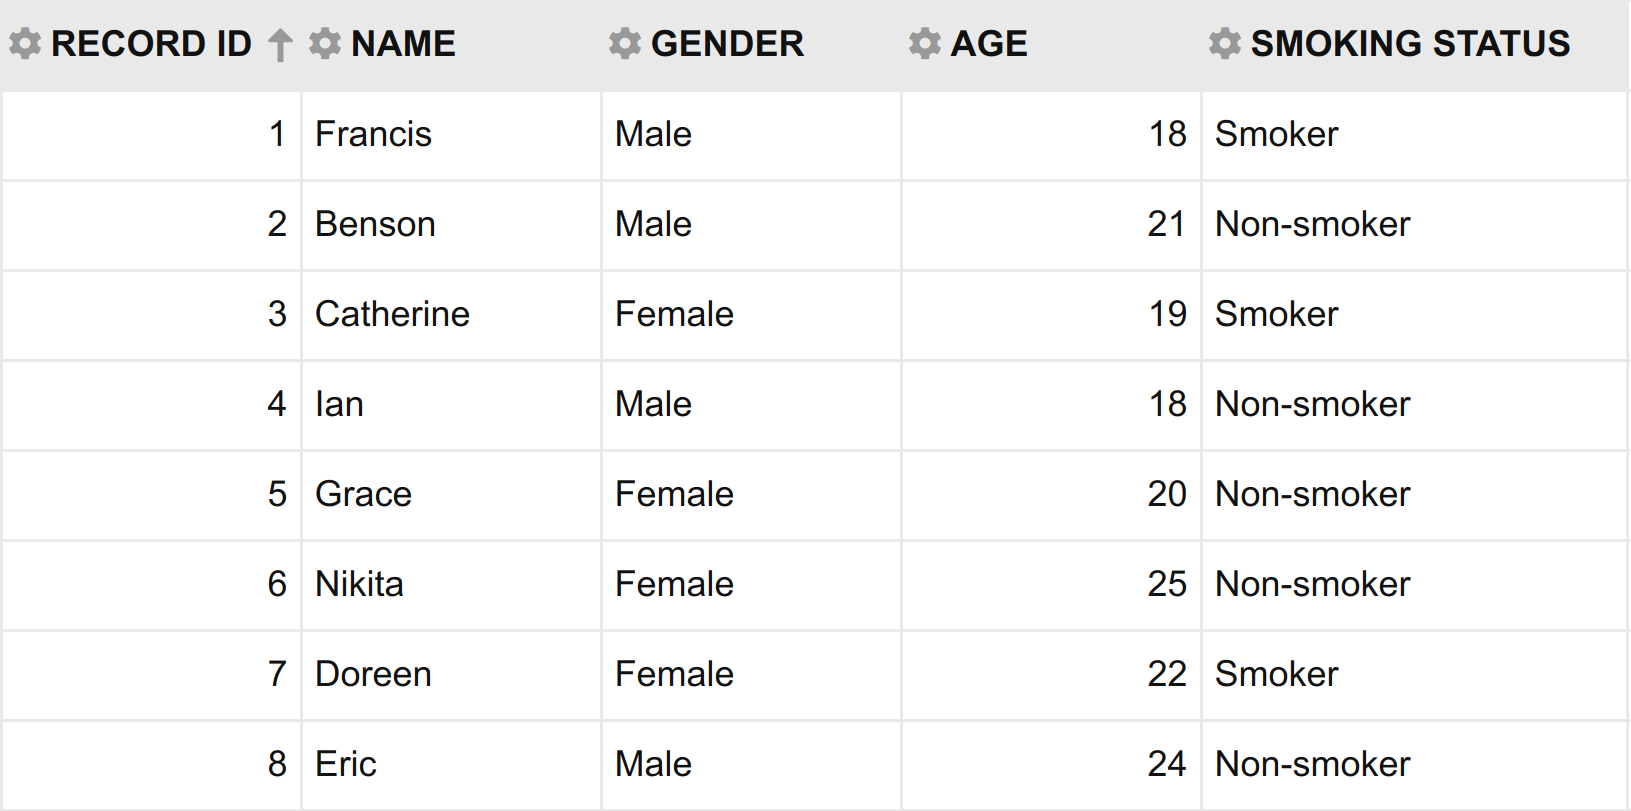
Let’s begin by discussing why you might want to use pivot tables in the first place. Consider the dataset below. It is a sample of 8 college students with 4 variables namely; Name, Gender, Age and Smoking Status.

Now consider the following questions.
- What is the mean age of the students?
- What is the median age of the male students?
- What is the minimum age of female students who smoke?
Pause for a moment and think about how you might answer each of these questions using your favorite statistical software. For this discussion, I will assume Microsoft Excel, but the principles are the same no matter which application you choose.

You might have noticed that the first question can be answered easily by running the Average function on the Age variable.
Answering the remaining two questions, however, is not as straightforward.
Let’s consider a naive approach to the second question. You would first order the dataset by Gender, then run the Median function on the Age variable for just the rows where Gender is equal to Male.
What about the third question?
Again, the naive approach involves ordering the dataset first by Gender and then by Smoking Status. Then, you run the Min function for just the cases where Gender is equal to Female and Smoking Status is equal to Smoker.
This might not seem difficult, but for a large sample size, it is not only tedious, it is also repetitive and error-prone. It is even harder for more complex statistics such as proportions – where intermediate counts must first be obtained before dividing by the total.
Fortunately, pivot tables make short work of precisely this class of problems. In Part 2 of this series, I will show you how to summarize a dataset like this and answer the 3 questions more easily.
Click here to read Part 2. Or watch the video instead.
i like to learn more about pivot table
point noted
Great tool Mr. Gitahi. Looks like it’s user friendly.
Great tool, looks like it’s user friendly.
Great ..need to learn more on pivot table