This is the first of a 3-part series discussing data verification as a component of Data Quality Assessment (DQA). In this installment, we shall introduce the concept of DQA in general, then delve deeper into the data verification part of it. The second installment will examine why MS Excel is currently the most popular tool for conducting data verification. We shall also identify some of the challenges associated with this approach. Finally, we shall introduce our easy-to-use and robust mobile data collection and analysis technology. We shall explain how it helps to improve the process of data verification. In particular, we shall describe how it solves the problems associated with MS Excel while preserving all the benefits.
In many parts of the developing world, governments and NGOs are constantly working towards eradicating some of humanity’s most pressing problems. Among these are disease, poverty and ignorance. In Kenya, for example, the National AIDS and STI Control Program (NASCOP) is charged with spearheading the Ministry of Health’s interventions on the fight against HIV/AIDS. As such, the program provides technical coordination of HIV/AIDS programs in the country, contributing to the bulk of the implementation of the Kenya Aids Strategic Framework (KASF) 2014 – 2019. Similar programs exist in other countries to fight not just HIV/AIDS but also Malaria, Tuberculosis and Non-Communicable Diseases (NCDs).
Strong M&E systems
Measuring the success and improving the management of these initiatives demands strong Monitoring and Evaluation (M&E) systems. Good systems produce high-quality data for decision making, thereby enabling programs to optimize their interventions for maximum impact. However, M&E systems on a national scale are inherently complex. They involve multiple stakeholders with varying interests and levels of accountability. To build confidence in the data used for decision making at higher levels, national programs have to periodically audit the integrity of these systems.
One widely adopted method of auditing M&E systems is Data Quality Assessment (DQA). DQA focuses on verifying the quality of reported data as well as assessing the underlying data management and reporting systems for standard program indicators. Data verification is one of several components of a properly executed DQA. Its purpose is to audit the accuracy and consistency of program indicators as reported upwards from the facility to the sub-national and national levels.
In order to track progress and formulate policy, national programs typically define a standard set of critical indicators to monitor. In the case of HIV/AIDS, for example, such indicators might include the Number of people tested for HIV, the Number of people who test positive and the Number of patients initiated on treatment in a given period. Inevitably, at the national level, the data that informs these indicators is aggregated from the thousands of health facilities across the country. In Kenya, for instance, individual health facilities independently track these indicators and report them upwards to the national program through a 3-step reporting pipeline.
3-step reporting pipeline
The first step in the reporting pipeline involves filling-out paper registers to record interactions with individual patients. For example, when a counselor conducts an HIV test, she makes a record of it in the register.
The second step involves tallying individual cases from the registers and summarizing the data in a standard reporting form. For the HIV/AIDS program in Kenya, this form is currently known as MOH 731. The form is filled once a month, with each entry representing the value for a particular indicator in that month.
The third and final step involves entering the summarized indicator values from the reporting form into the District Health Information System (DHIS). For some indicators, data from the reporting form is also entered into the Data for Accountability Transparency and Impact (DATIM) system. The national program relies on the DHIS for decision making. Some development agencies use DATIM for their own programming internally.
The perfect reporting pipeline
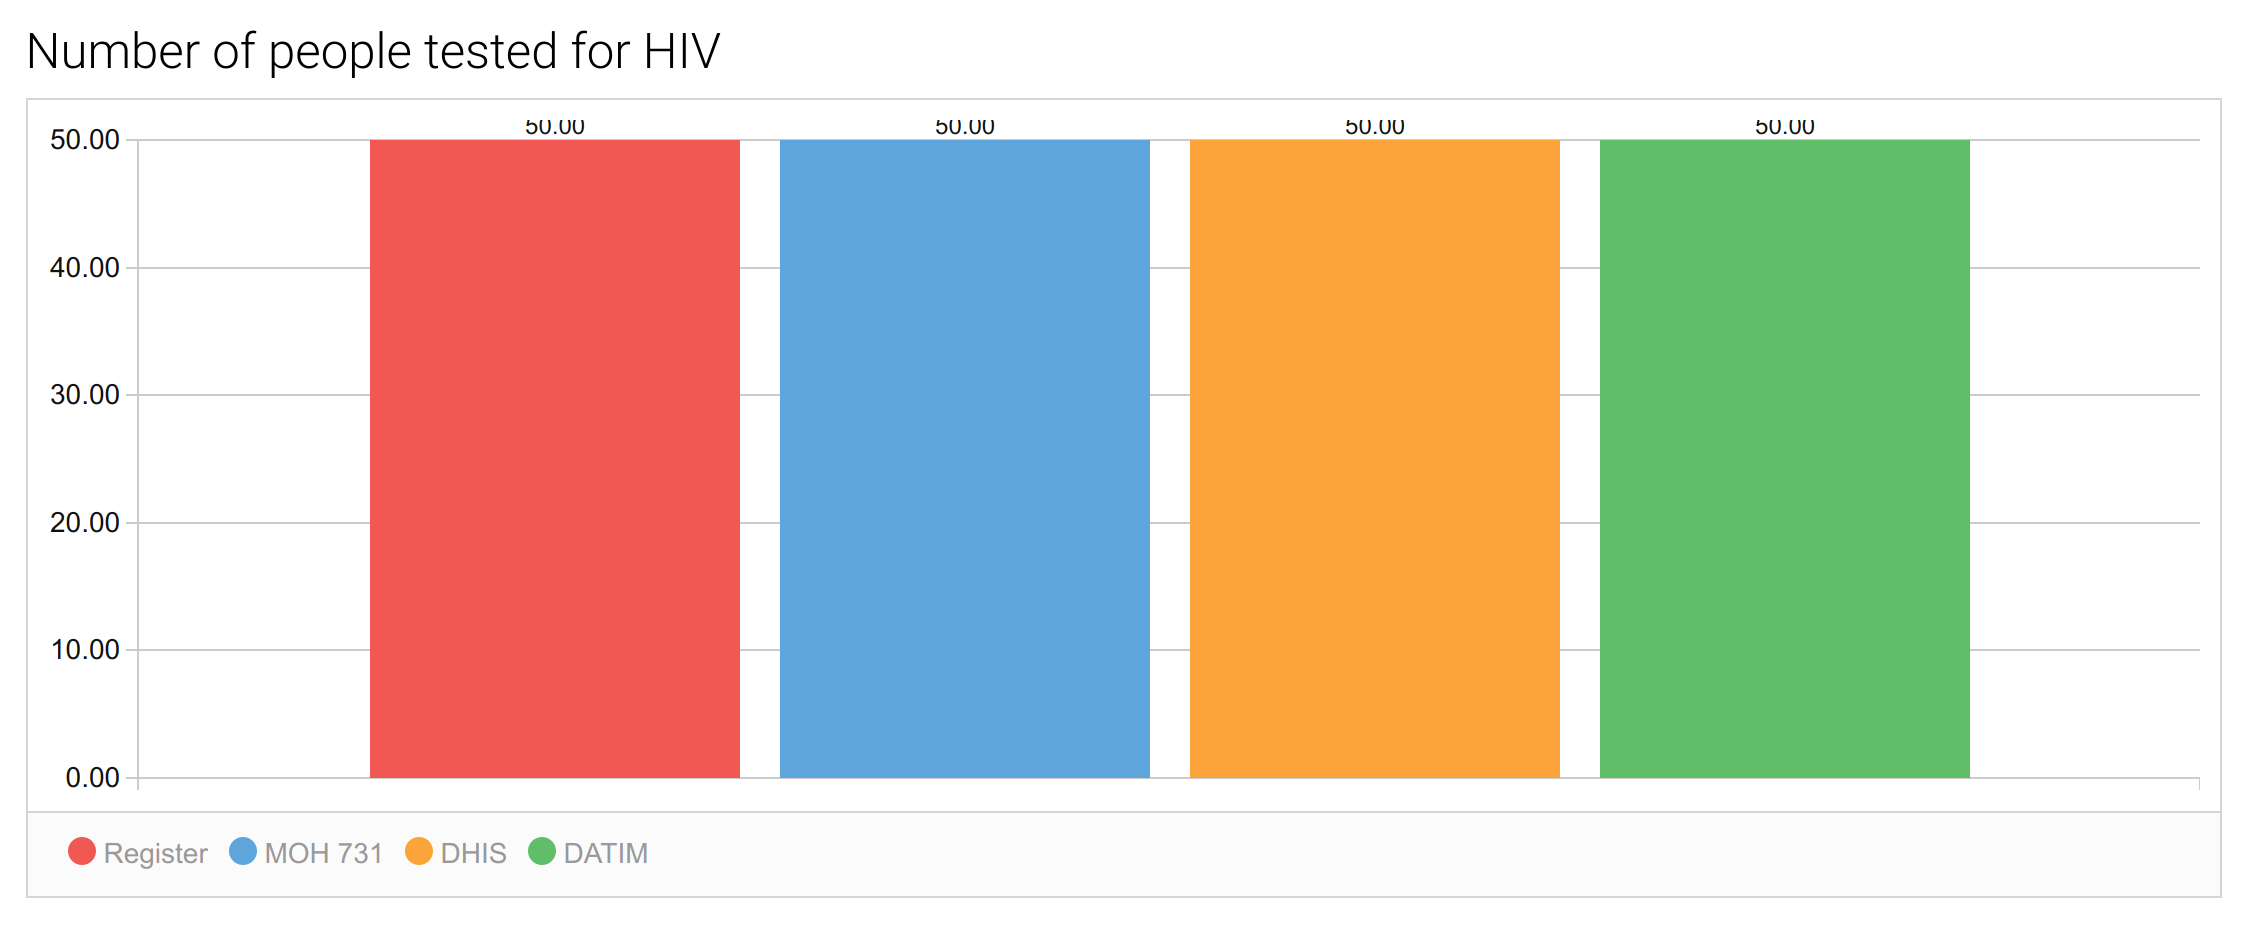
Now, consider a health facility that tests 50 people for HIV in the month of January and correctly records the data in the register. The perfect reporting pipeline would maintain the integrity of this number by reporting it accurately and consistently throughout the 3 steps. In other words, there would be no disparity in the value reported in the Register, the summary form, the DHIS and DATIM. A graph comparing data from all 4 sources would look like this.

In this case, the national program would have a picture-perfect view of the Number of people tested for HIV. If all health facilities reported as accurately across all the standard indicators, the national program would be confident that the decisions they make on the basis of DHIS data are well-informed.
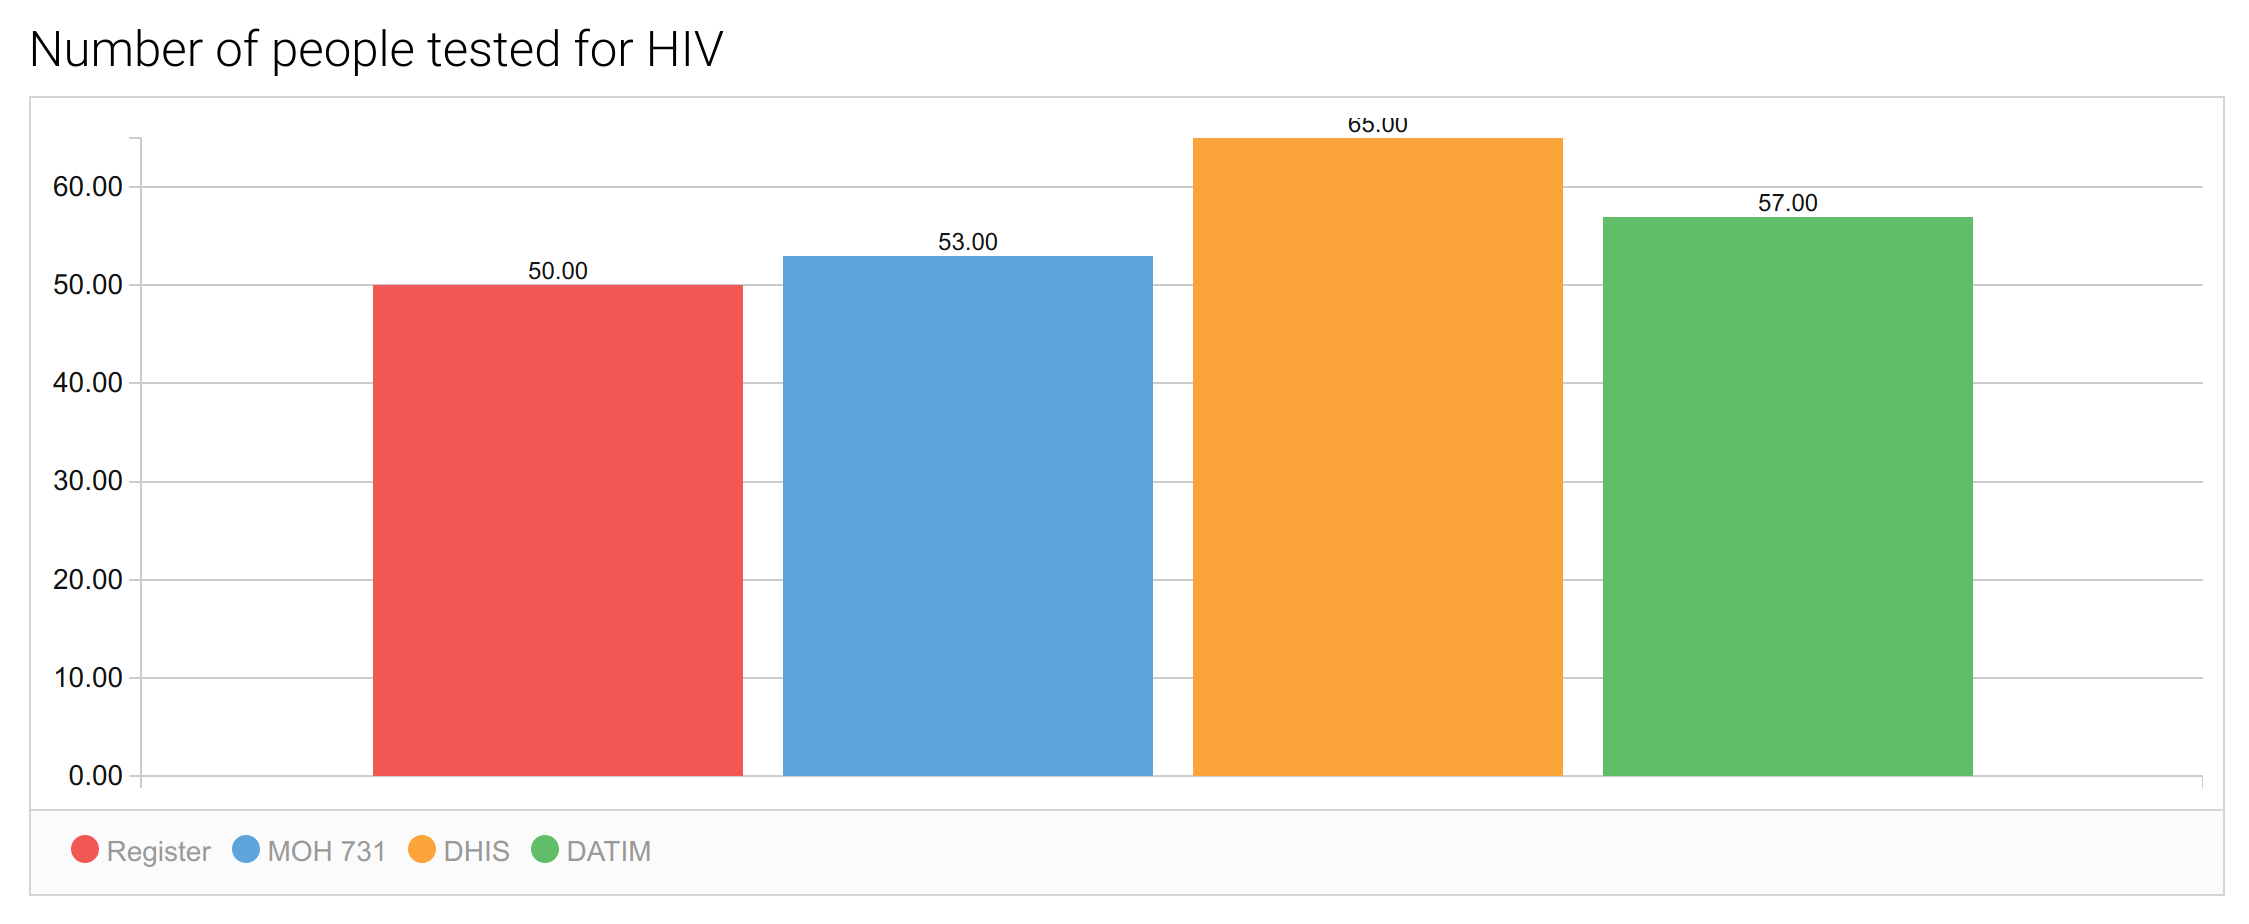
In reality, the reporting pipeline rarely works perfectly. Disparities occur for a variety of reasons that are beyond the scope of this discussion. The primary objective of data verification, therefore, is to identify and quantify any inconsistencies occurring in the pipeline. The graph below shows what an imperfect reporting pipeline might look like. Notice that the value for the indicator is inconsistent across the different steps. In this case, the national program received an inflated report on the Number of people tested for HIV (65 instead of 50 or 30% over-reporting).

The goals of data verification
As a component of DQA, data verification must be meaningful at two levels. At the micro level, it must help individual health facilities understand the accuracy and consistency of their own reporting. At the macro level, it must help the program assess the quality of reporting at the sub-national and national levels.
At each level, data verification must help detect and quantify inconsistencies in program indicators as reported at the various steps. Secondly, it must attempt to explain the reasons for those inconsistencies, which then form the basis for Data Quality Improvement (DQI) plans. At the sub-national and national levels, data verification should also rank health facilities by conformance to data quality standards. For example, a health facility that tests 50 people but reports 80 is doing far worse, and skewing national results more, than one that tests 50 people but reports 55. This is important in prioritizing and allocating resources for DQI interventions.
Clearly, data verification is a complex undertaking. It demands not just the ability to collect and enter data in the field but also the need to analyze it on the spot for dissemination and review. As a result, many programs rely on Microsoft Excel spreadsheets for this purpose. In the second part of this series, we shall discuss how this is done and identify the inherent challenges associated with this approach. In the third and final part of the series, we shall describe how our mobile data collection and analysis technology addresses these challenges.
DQA is equally important to improve data quality.